Performance and Profiling
What is Software Profiling
Software profiling is the act of using instrumentation to objectively measure the performance of your application.
“Performance” can be a measure of any of the following:
resource use (CPU, memory)
frequency or duration of function calls
wall clock execution time of part or all of your application
Collecting this data involves instrumenting the code. In Python, this happens at runtime.
The instrumentation creates overhead, so it has a performance cost.
The output data – the “profile” – will be a statistical summary of the execution of functions.
An optimization strategy
Write the code for maintainability and readability
Test for correctness
Collect profile data
If it is optimized to your targets – fast enough, resource limited enough – then quit because your job here is done
If it is not then optimize the most expensive parts based on profiling data
Repeat starting from step 2
Programmers waste enormous amounts of time thinking about, or worrying about, the speed of noncritical parts of their programs. These attempts at efficiency actually have a strong negative impact when debugging and maintenance are considered. We should forget about small efficiencies, say about 97% of the time:
Premature optimization is the root of all evil.
—Donald Knuth
Steps to Better Performance
In order of importance:
Efficient Algorithms (big O, etc…)
Appropriate Python data types, etc.
Appropriate Python style
Specialized packages (numpy, scipy)
Calling external packages
Extending with C/C++/Fortran/Cython/Rust
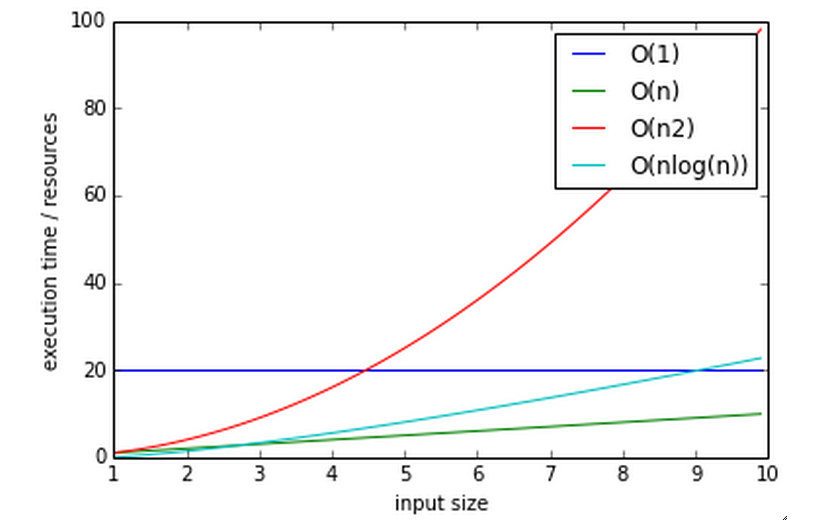
Big O notation
The efficiency of an algorithm is often described in “big O” notation.
The letter O is used because the growth rate of a function is also referred to as Order of the function.
It describes how an algorithm behaves in terms of resource use as a function of amount of input data.
O(1) - Constant performance. Execution time stays constant regardless of how much data is supplied.
Example: adding to a dict
O(n) - Time goes up linearly with number of items.
Example: scanning lists
O(n2) - Time goes up quadratically with number of items.
Example: bubble sort, worst case
O(log(n)) - goes up with the log of number of items
Example: bisection search
log? You expect me to remember that math???
Let’s think about that a bit.
Anyone know what a bisection search is?
Why is that O(log(n))?
Reference: https://wiki.python.org/moin/TimeComplexity
Measuring Time with a Stopwatch
One way to measure performance is with a stopwatch.
Start the clock when a unit of code such as a function begins, and stop it when the code returns
This is a the simplest method, and we can instrument our code to start and stop the clock.
Like most timing benchmarks, data obtained is valid only for the particular test environment – for that machine/OS/Python version, etc.
Relative timings may be valid across systems, but can also diverge.
For instance a run on a machine with fast network and slow disk may produce much different results on a system with slow network and fast disk.
time.perf_counter() versus time.time()
Using the time module as a profiling decorator.
time.time() returns the Unix system time, aka the wall clock time.
time.perf_counter() returns the CPU time of the current process optimized for performance tuning.
Precision is system dependent. It is quite coarse, but it can capture the big picture.
See ../examples/profiling/timer/timer_test.py
import time

def timer(func):
    def timer(*args, **kwargs):
        """a decorator which prints execution time of the decorated function"""
        t1 = time.perf_counter()
        result = func(*args, **kwargs)
        t2 = time.perf_counter()
        print("-- executed %s in %.4f seconds" % (func.func_name, (t2 - t1)))
        return result
    return timer

@timer
def expensive_function():
    time.sleep(1)

@timer
def less_expensive_function():
    time.sleep(.02)

expensive_function()
less_expensive_function()
timeit
This decorator can be used for testing small bits of code.
You can use to test hypotheses about efficiency of algorithms and Python idioms.
It will run the given statement many times and calculate the average execution time.
You can also run from the command line:
python -m timeit '"-".join(str(n) for n in range(100))'
See: https://docs.python.org/3/library/timeit.html
See the timeit.py source: https://github.com/python/cpython/blob/main/Lib/timeit.py
timeit command line interface
Options:
-n/--number N: How many times to execute ‘statement’. If not provided then the code will be run until it elapses at least 0.2 seconds.-r/--repeat N: How many times to repeat the timer. The default is 5.-u/--unit: Set the output time unit to either:nsec,usec,msec, orsec.
$ python -m timeit -n 1000 "len([x**2 for x in range(1000)])"
timeit can also be imported as a module: http://docs.python.org/3/library/timeit.html#timeit.timeit
timeit.timeit(stmt='pass',
              setup='pass',
              timer=<default timer>,
              number=1000000)
The setup kwarg contains a string of Python code to execute before the loops start, so that code is not part of the test.
import timeit
statement = "char in text"
setup_code = """text = "sample string";char = "g" """
timeit.timeit(statement, setup=setup_code)
timeit via iPython magic
Note that all that setup_code stuff is kind of a pain. Fortunately, iPython has your back yet again.
%timeit pass

u = None
%timeit u is None

%timeit -r 4 u == None

import time

%timeit -n1 time.sleep(2)

%timeit -n 10000 "f" in "food"
See: timeit magic
Exercise
We just tried determining if a character exists in a string:
statement = "'f' in 'food'"
timeit.timeit(statement)
Run timeit with an alternative statement:
statement2 = "'food'.find('f') >= 0"
timeit.timeit(statement2)
Which is faster? Why?
Getting More Detailed with Profiling
That kind of timing is only useful if you know what part of the code you want to optimize.
But what if you know your program is “slow”, but don’t know where is is spending the time?
Do not guess! You will often be wrong, and you don’t want to waste time optimizing the wrong thing.
Really! Even very experienced programmers are often wrong about where the bottlenecks are.
You really need to profile to be sure.
Also: take into account the entire run-time. Does it make sense to optimize an initialization routine that takes a few seconds before a multi-hour run?
A profiler takes measurements of runtime performance and summarizes results into a profile report.
Reported metrics could include:
Memory used over time
Memory allocated per function
Frequency of function calls
Duration of function calls
Cumulative time spent in subfunction calls
Python’s Built-in Profilers
Python comes with a couple profiling modules
profile- Older and pure Python. If you need to extend the profiler, this might be good. Otherwise, it’s slow.cProfile- It has the same API as profile, but written in C for less overhead.
You almost always want to use ``cProfile``.
cProfile
The cProfile profiler can be run as a module on an entire application:
python -m cProfile [-o output_file] [-s sort_order] read_bna.py
11111128 function calls in 8.283 seconds
Ordered by: standard name

ncalls  tottime  percall  cumtime  percall filename:lineno(function)
     1    0.000    0.000    0.000    0.000 integrate.py:1()
11111110  2.879    0.000    2.879    0.000 integrate.py:1(f)
[....]
ncalls: number of calls
tottime: total time spent in function, excluding time in sub-functions
percall: tottime / ncalls
cumtime: total time spent in function, including time in sub-functions
percall: cumtime / ncalls
filename:lineno – location of function
Analyzing Profile Data
Output the profiler data to a binary dump with -o <filename> argument.
While doing performance work, save your profiles for comparison later. This helps ensure that any changes do actually increase performance.
A profile dump file can be read with pstats.
python -m pstats
Running without arguments gives you a command line interface. You can type help for help.
pstats
python -m cProfile -o prof_dump ./read_bna.py
python -m pstats
% read prof_dump

# show stats:
prof_dump% stats

# only the top 5 results:
prof_dump% stats 5

# sort by cumulative time:
prof_dump% sort cumulative

# shorten long filenames for display:
prof_dump% strip
# show results again:
prof_dump% stats 5
pstats also has method calls:
import pstats
p = pstats.Stats('prof_dump')
p.sort_stats('calls', 'cumulative')
p.print_stats()
Output can be restricted via arguments to print_stats(). Each restriction is either an integer – to select a count of lines – a decimal fraction between 0.0 and 1.0 inclusive – to select a percentage of lines – or a regular expression to pattern match the standard name that is printed. If several restrictions are provided, then they are applied sequentially.
Analyzing Profile Data
Inspect only your local code with regular expression syntax:
import pstats
prof = pstats.Stats('prof_dump')
prof.sort_stats('cumulative')
prof.print_stats('^./[a-z]*.py:')
I tend to write little scripts like this so I don’t have to remember the commands.
Boosting Python Performance
There are ways to better structure your Python code to improve performance.
A Few Key Approaches
Overhead in function/method runtime lookup can be significant for small frequent calls.
Inlining code or caching function results might help.
Python string handling idioms: use
"".join(list_of_strings)rather than sequential calls to+=.Using list comprehensions, generator expressions,
or map()instead of for loops can be faster.Leverage existing domain specific C extension libraries, for instance numpy for fast array operations.
Rewrite expensive code as C modules. Use ctypes, Cython, SWIG, …
See: http://wiki.python.org/moin/PythonSpeed/PerformanceTips/
Managing Memory
Don’t forget memory! Processors are fast, but it can take longer to push the memory around than do the computation.
So keep in mind for big data sets:
Use the right data structures
Use efficient algorithms
Use generators and iterators, rather than lists.
Use iterators to pull in the data you need from databases, sockets, files, etc., rather than materialized lists.
Distraction: pyGame
There is a nice profiling example that uses PyGame: http://www.pygame.org/hifi.html